SpectraView Studio
A precision loudness and spectrum analyzer for audio files on iPad — and, via Designed for iPad, runs natively on Apple Silicon Macs. Open or drop a file, get broadcast-spec EBU R128 / BS.1770-4 measurements and a GPU-rendered spectrogram in seconds. Built for mastering engineers, podcast producers, broadcasters and anyone who needs to verify that a final mix meets the spec it was delivered for.
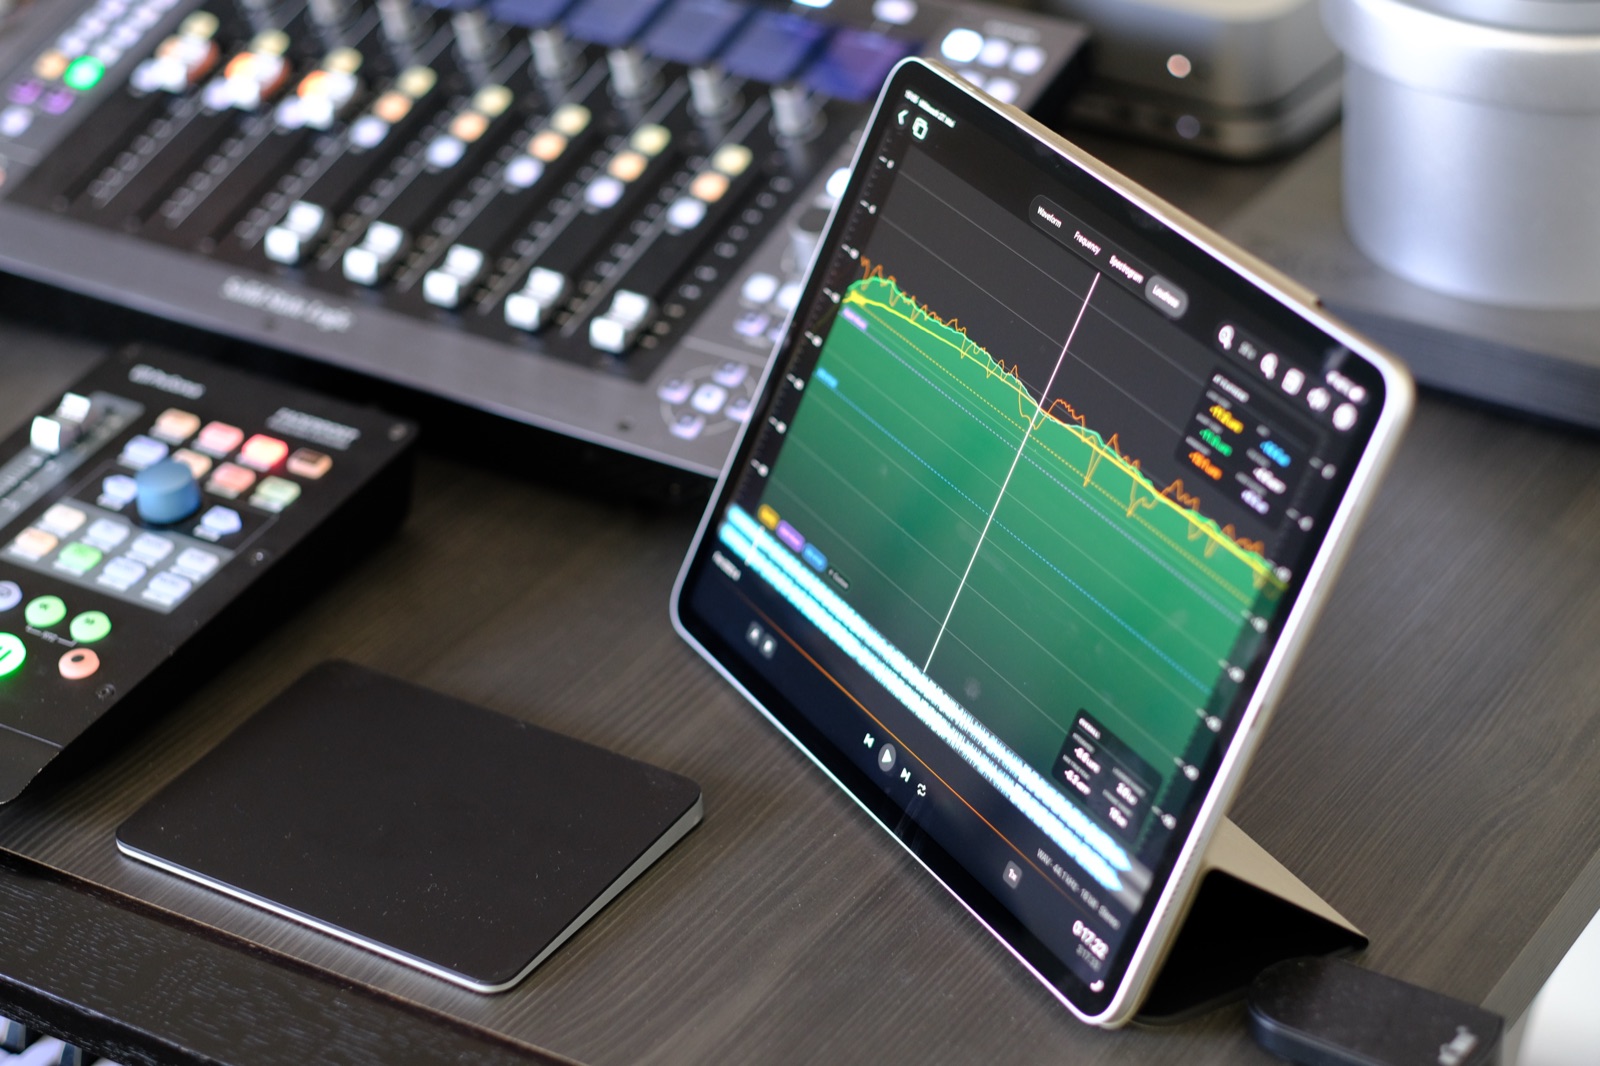
Drop a file in, read the numbers out.
Open an audio file via drag-and-drop, the share sheet or the system file picker. SpectraView Studio decodes it, runs it through a BS.1770-4 K-weighted gated loudness meter and a GPU-rendered spectrogram engine, and presents both views side-by-side with a synchronised playhead.
Save your working folders as bookmarks and they're one tap away in the next session. Need to capture something off-device? Hit the Record button to record directly from any iPad input into the app.
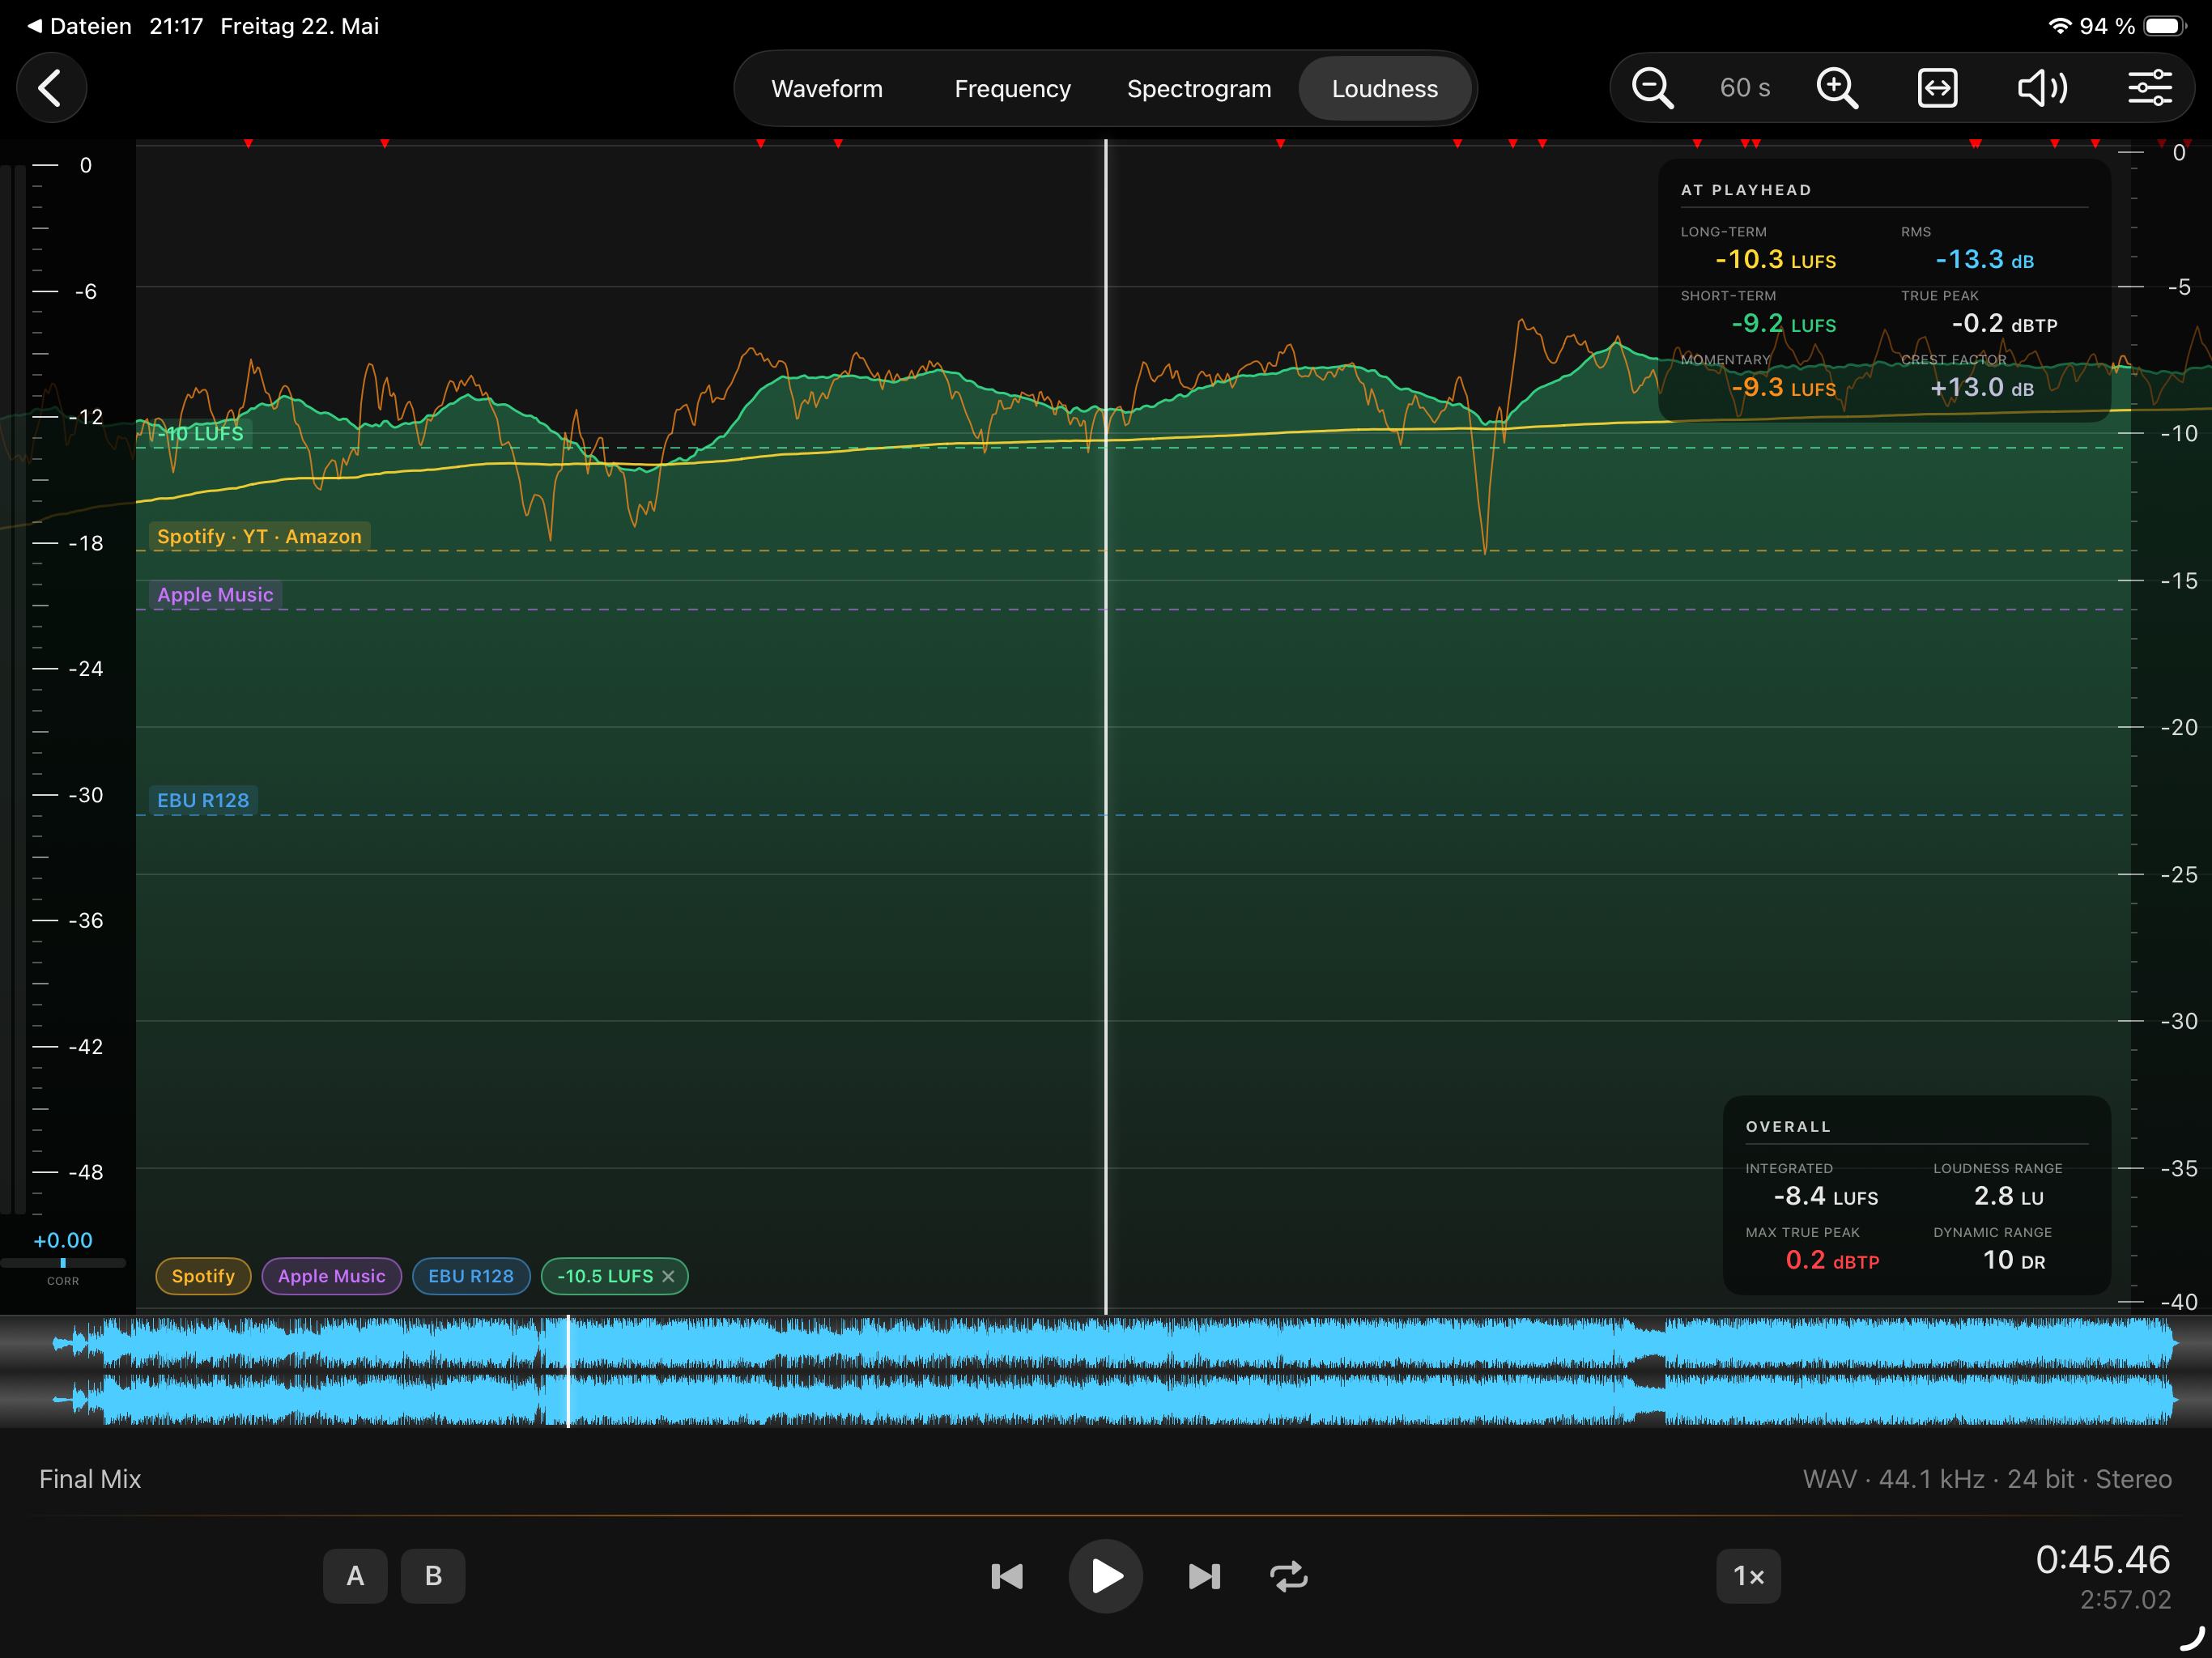
Broadcast-grade measurements, all in one view.
- Integrated LUFS with full two-stage gating (absolute −70 LUFS + relative −10 LU) per ITU-R BS.1770-4.
- Short-Term LUFS on a 3-second sliding window, plotted as a curve over the file duration.
- Momentary LUFS on a 400 ms window, available as a toggleable overlay.
- True-Peak with 4× polyphase oversampling per BS.1770-4 Annex 2 — catches inter-sample peaks that Sample-Peak misses.
- Sample-Peak per channel (L / R) with hold.
- Loudness Range (LRA) using the 10th–95th percentile of gated Short-Term values, per EBU Tech 3342.
- RMS, Crest Factor and Dynamic Range computed alongside the loudness metrics.
- Targets and reference lines (−14 / −16 / −23 LUFS, plus a free user target) drawn directly on the timeline.
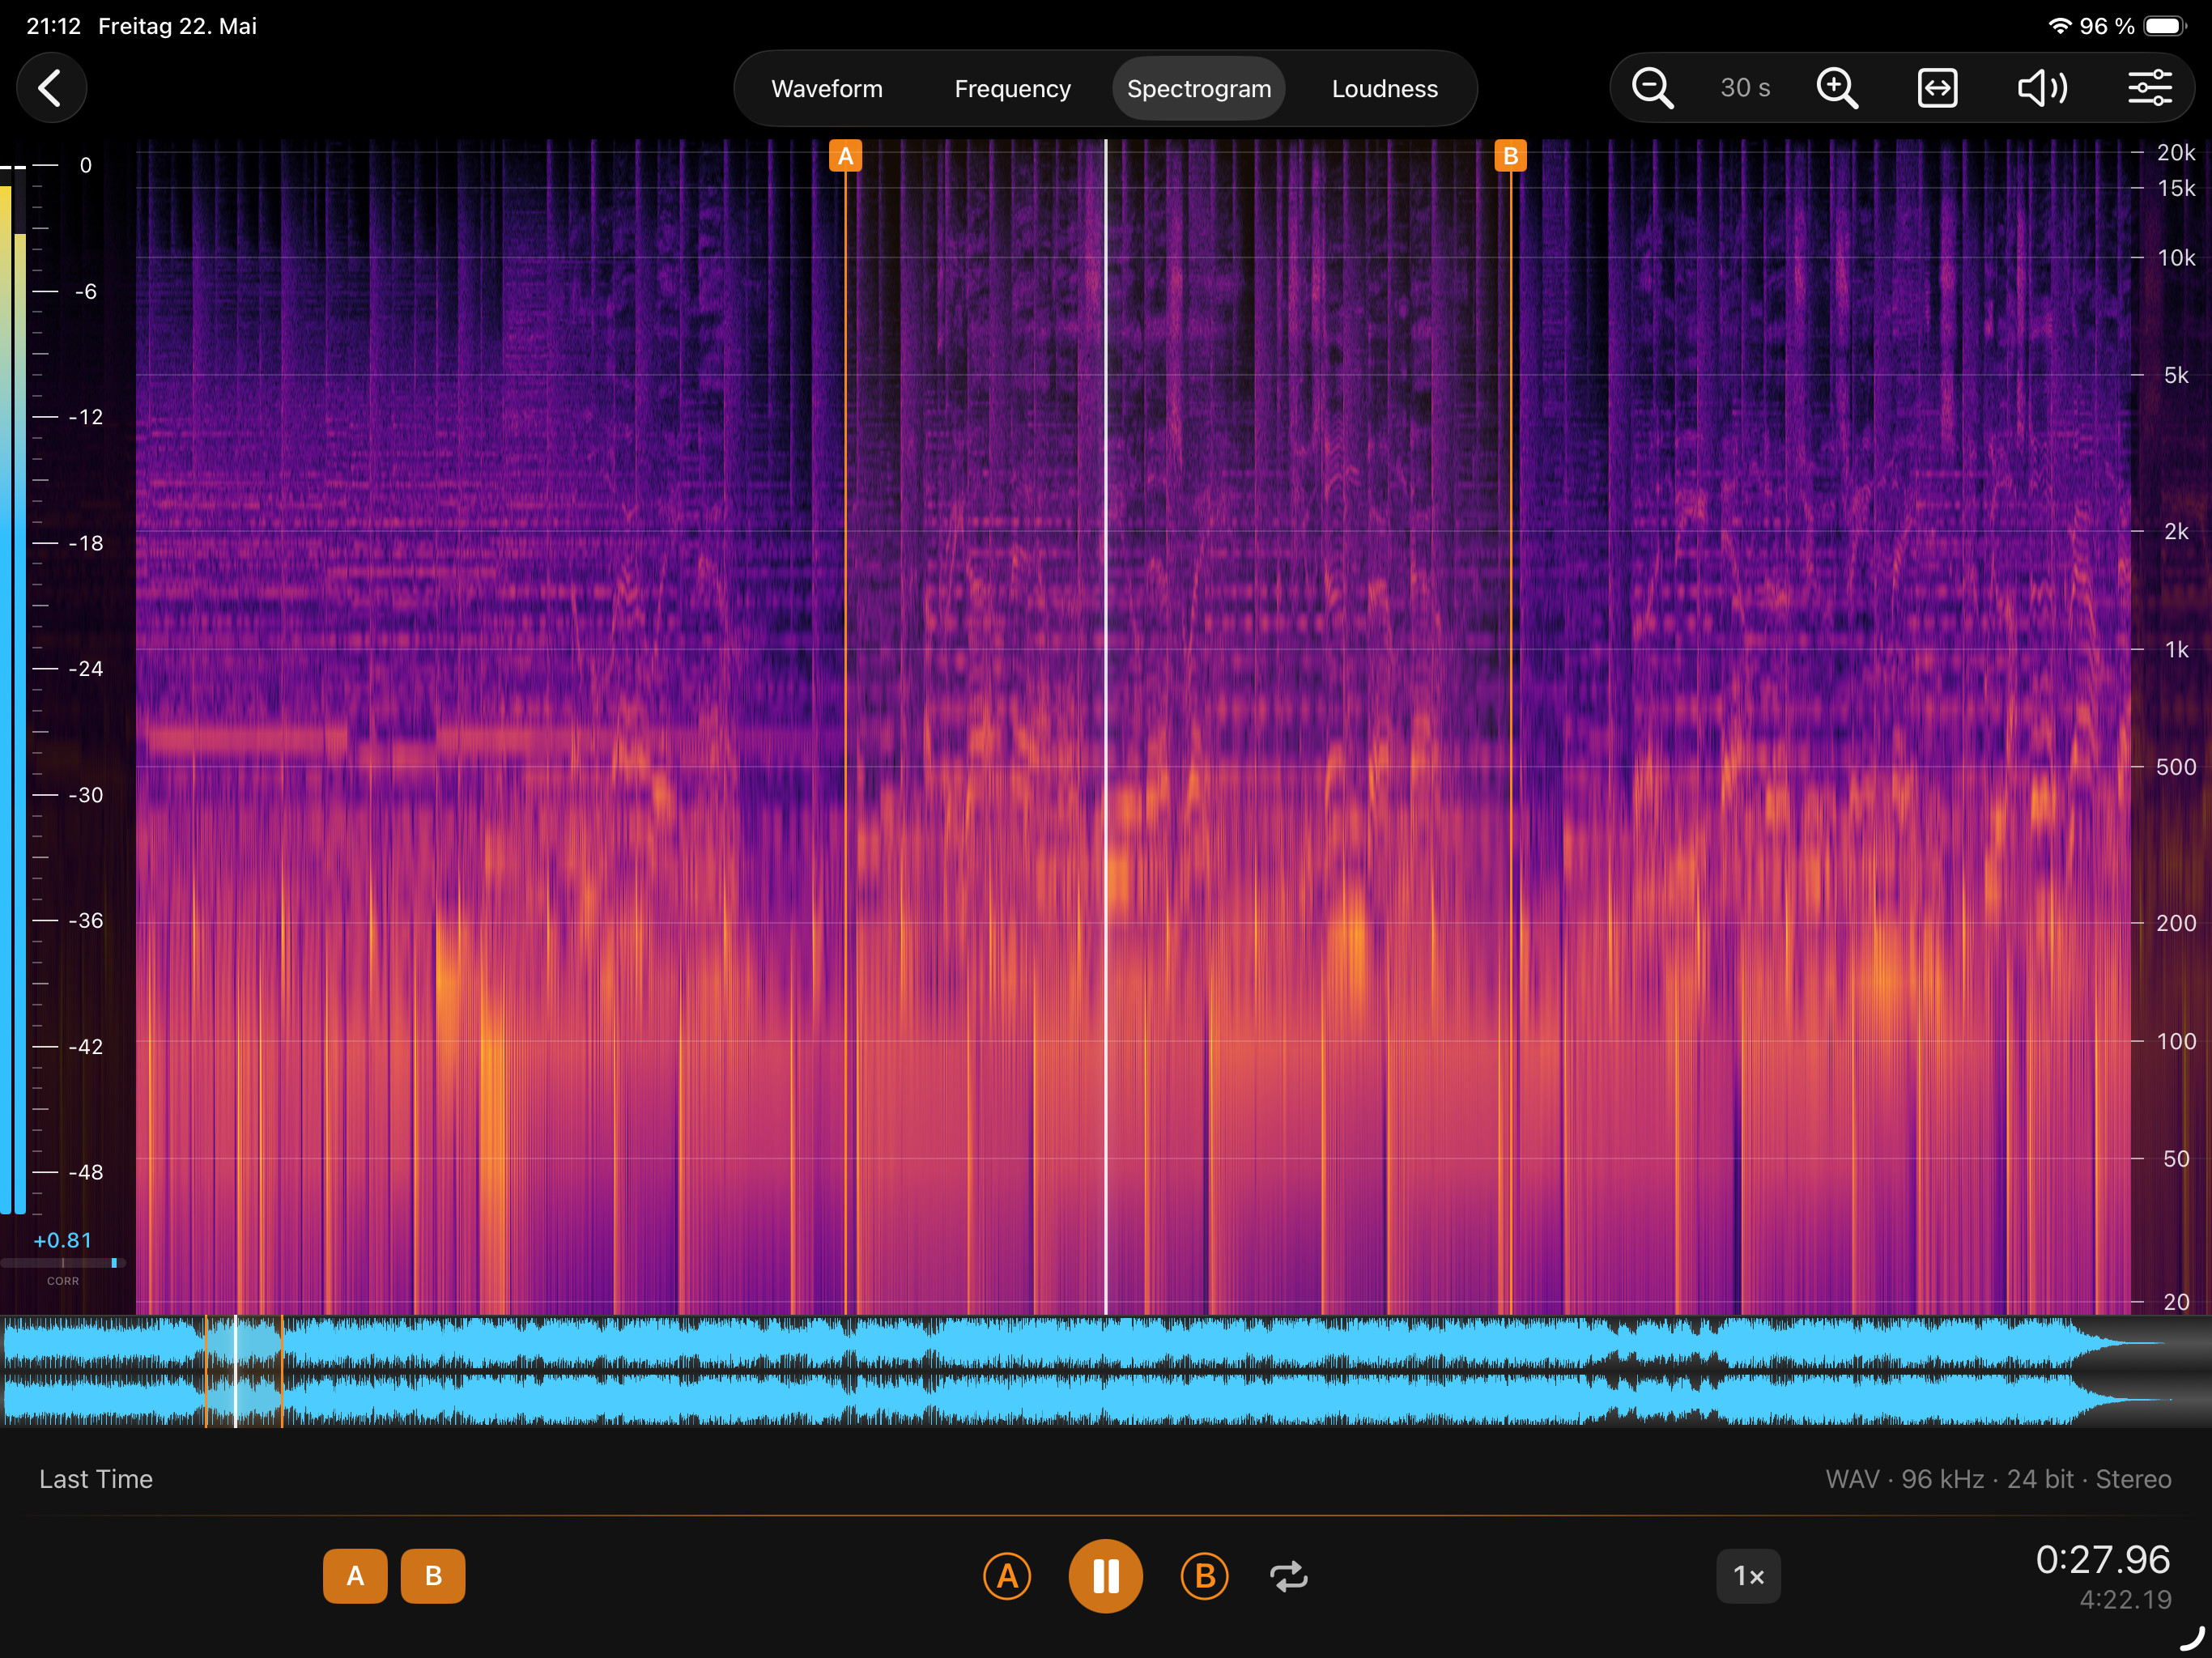
A GPU-rendered spectrogram, tunable to your needs.
- Configurable FFT size and window function.
- Adjustable dynamic range and palette for low-level detail.
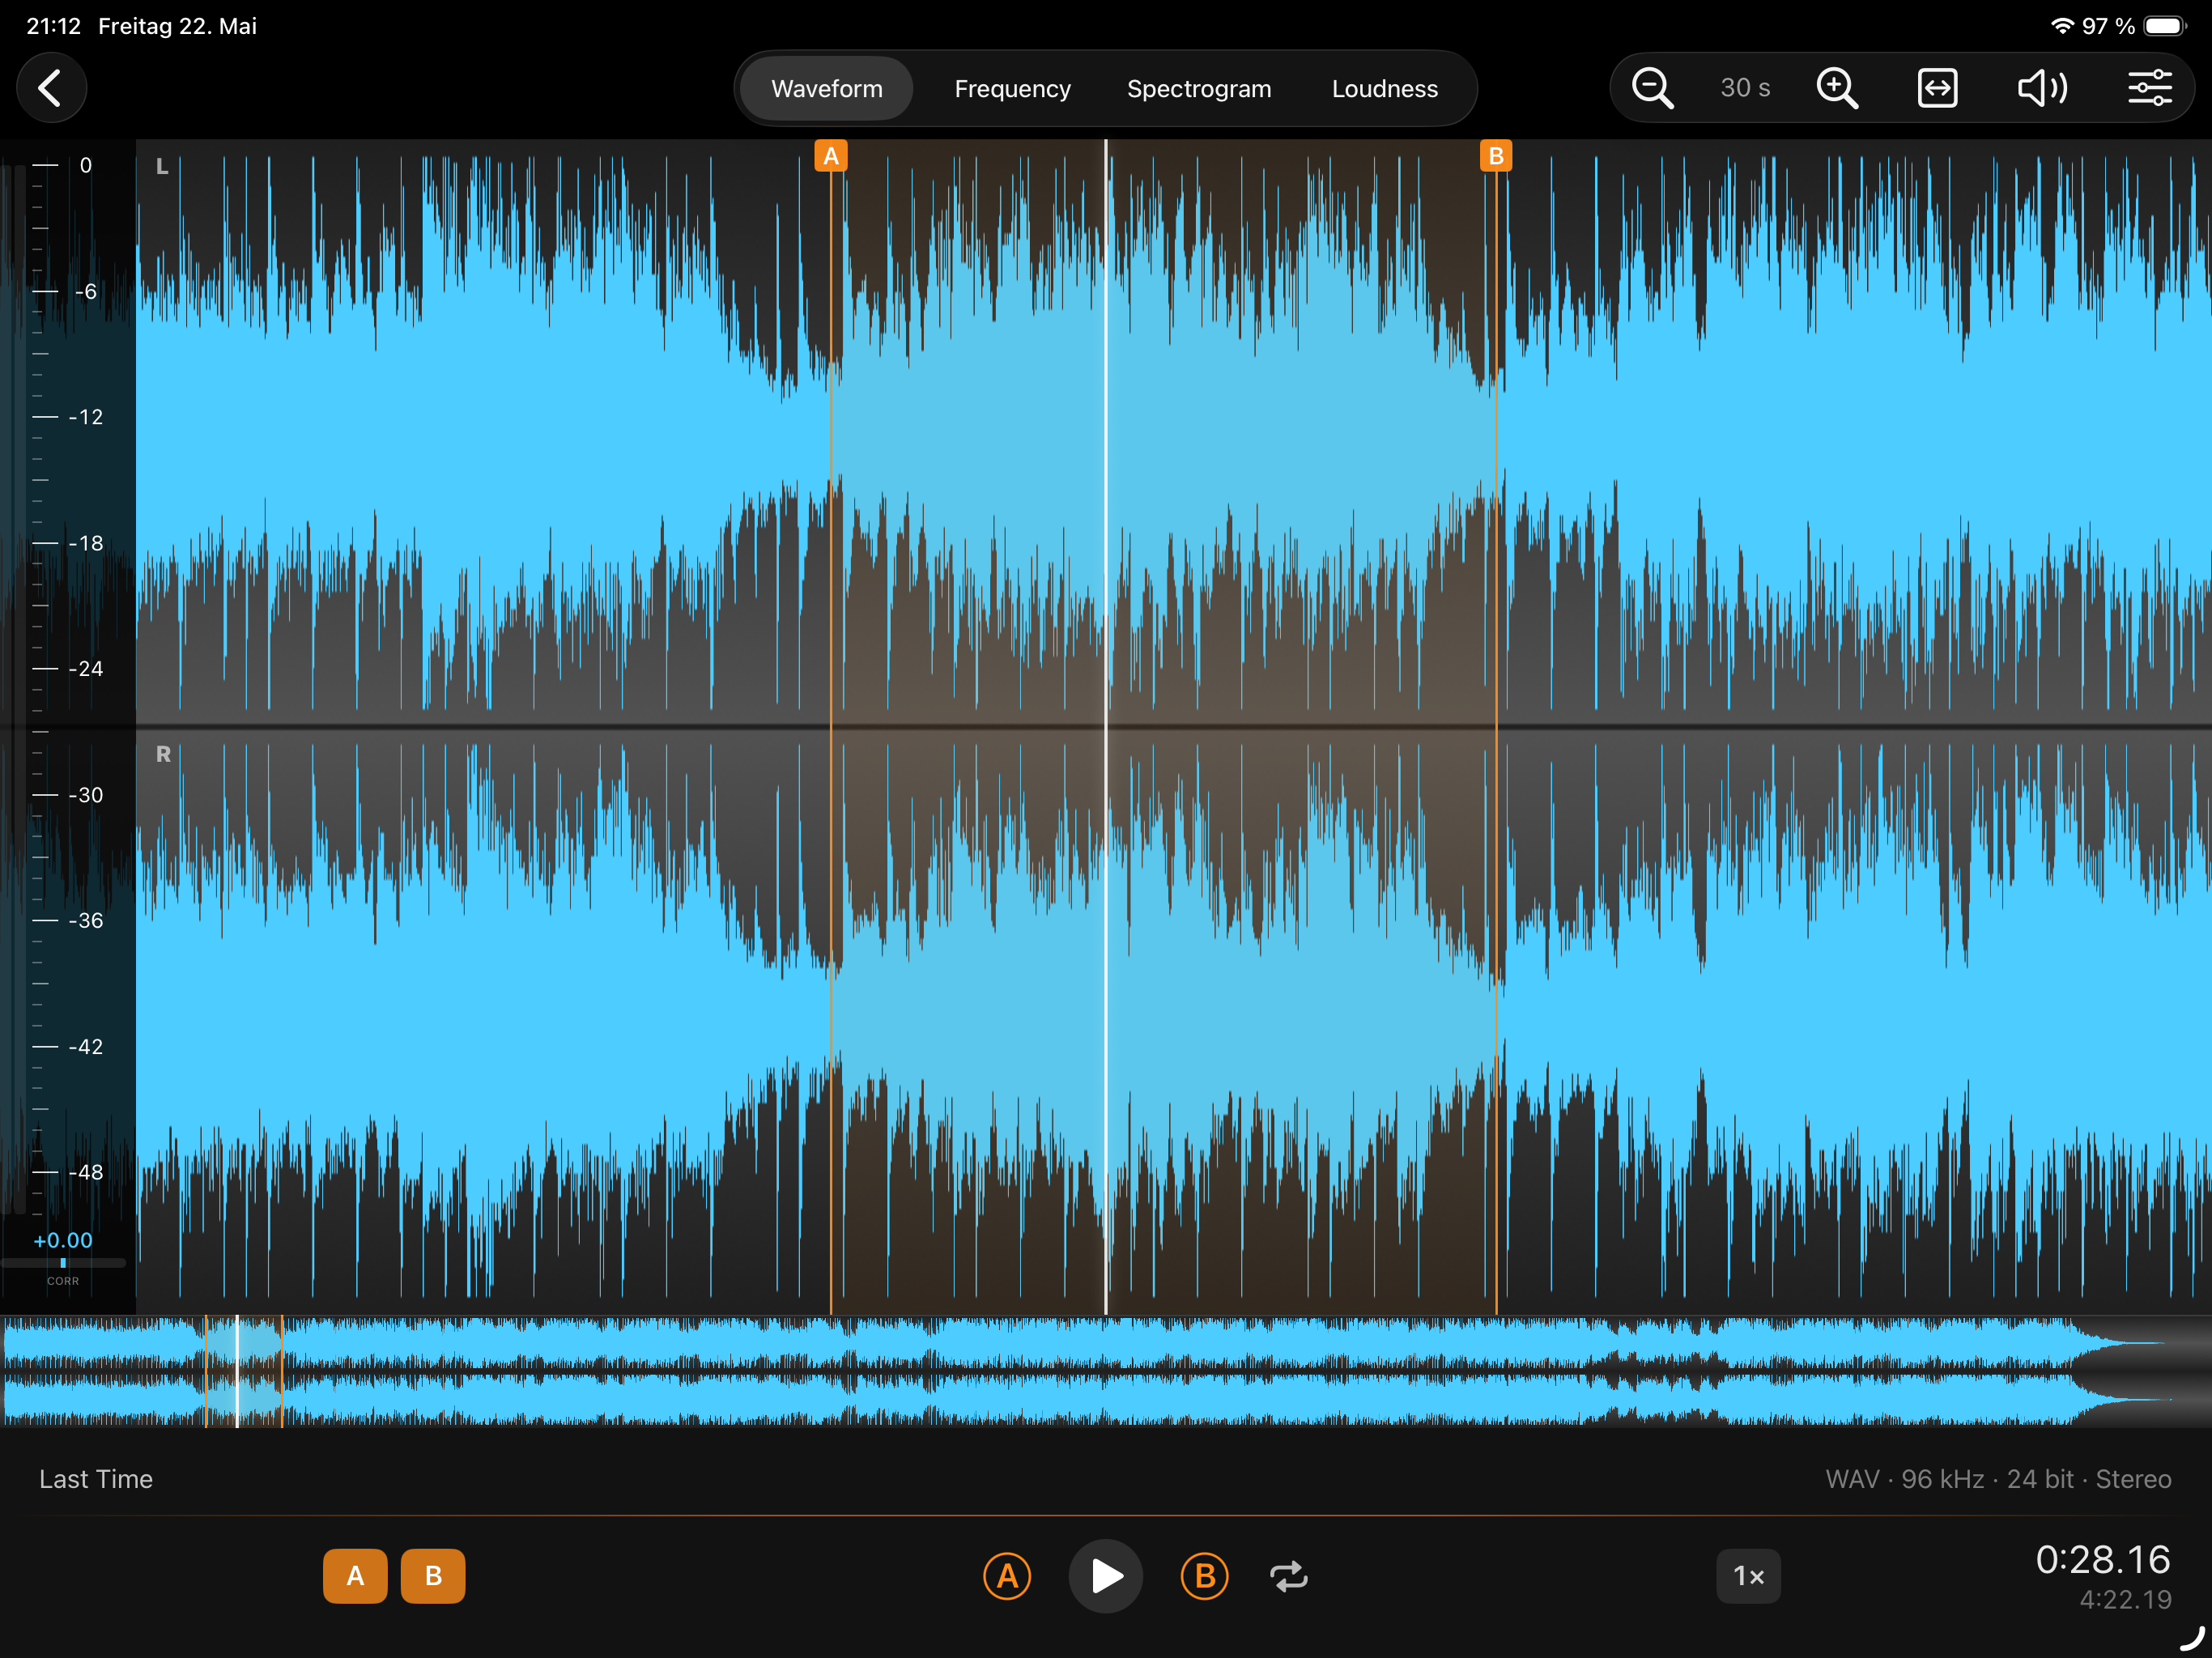
- Synchronised playhead across waveform, loudness curve and spectrogram.
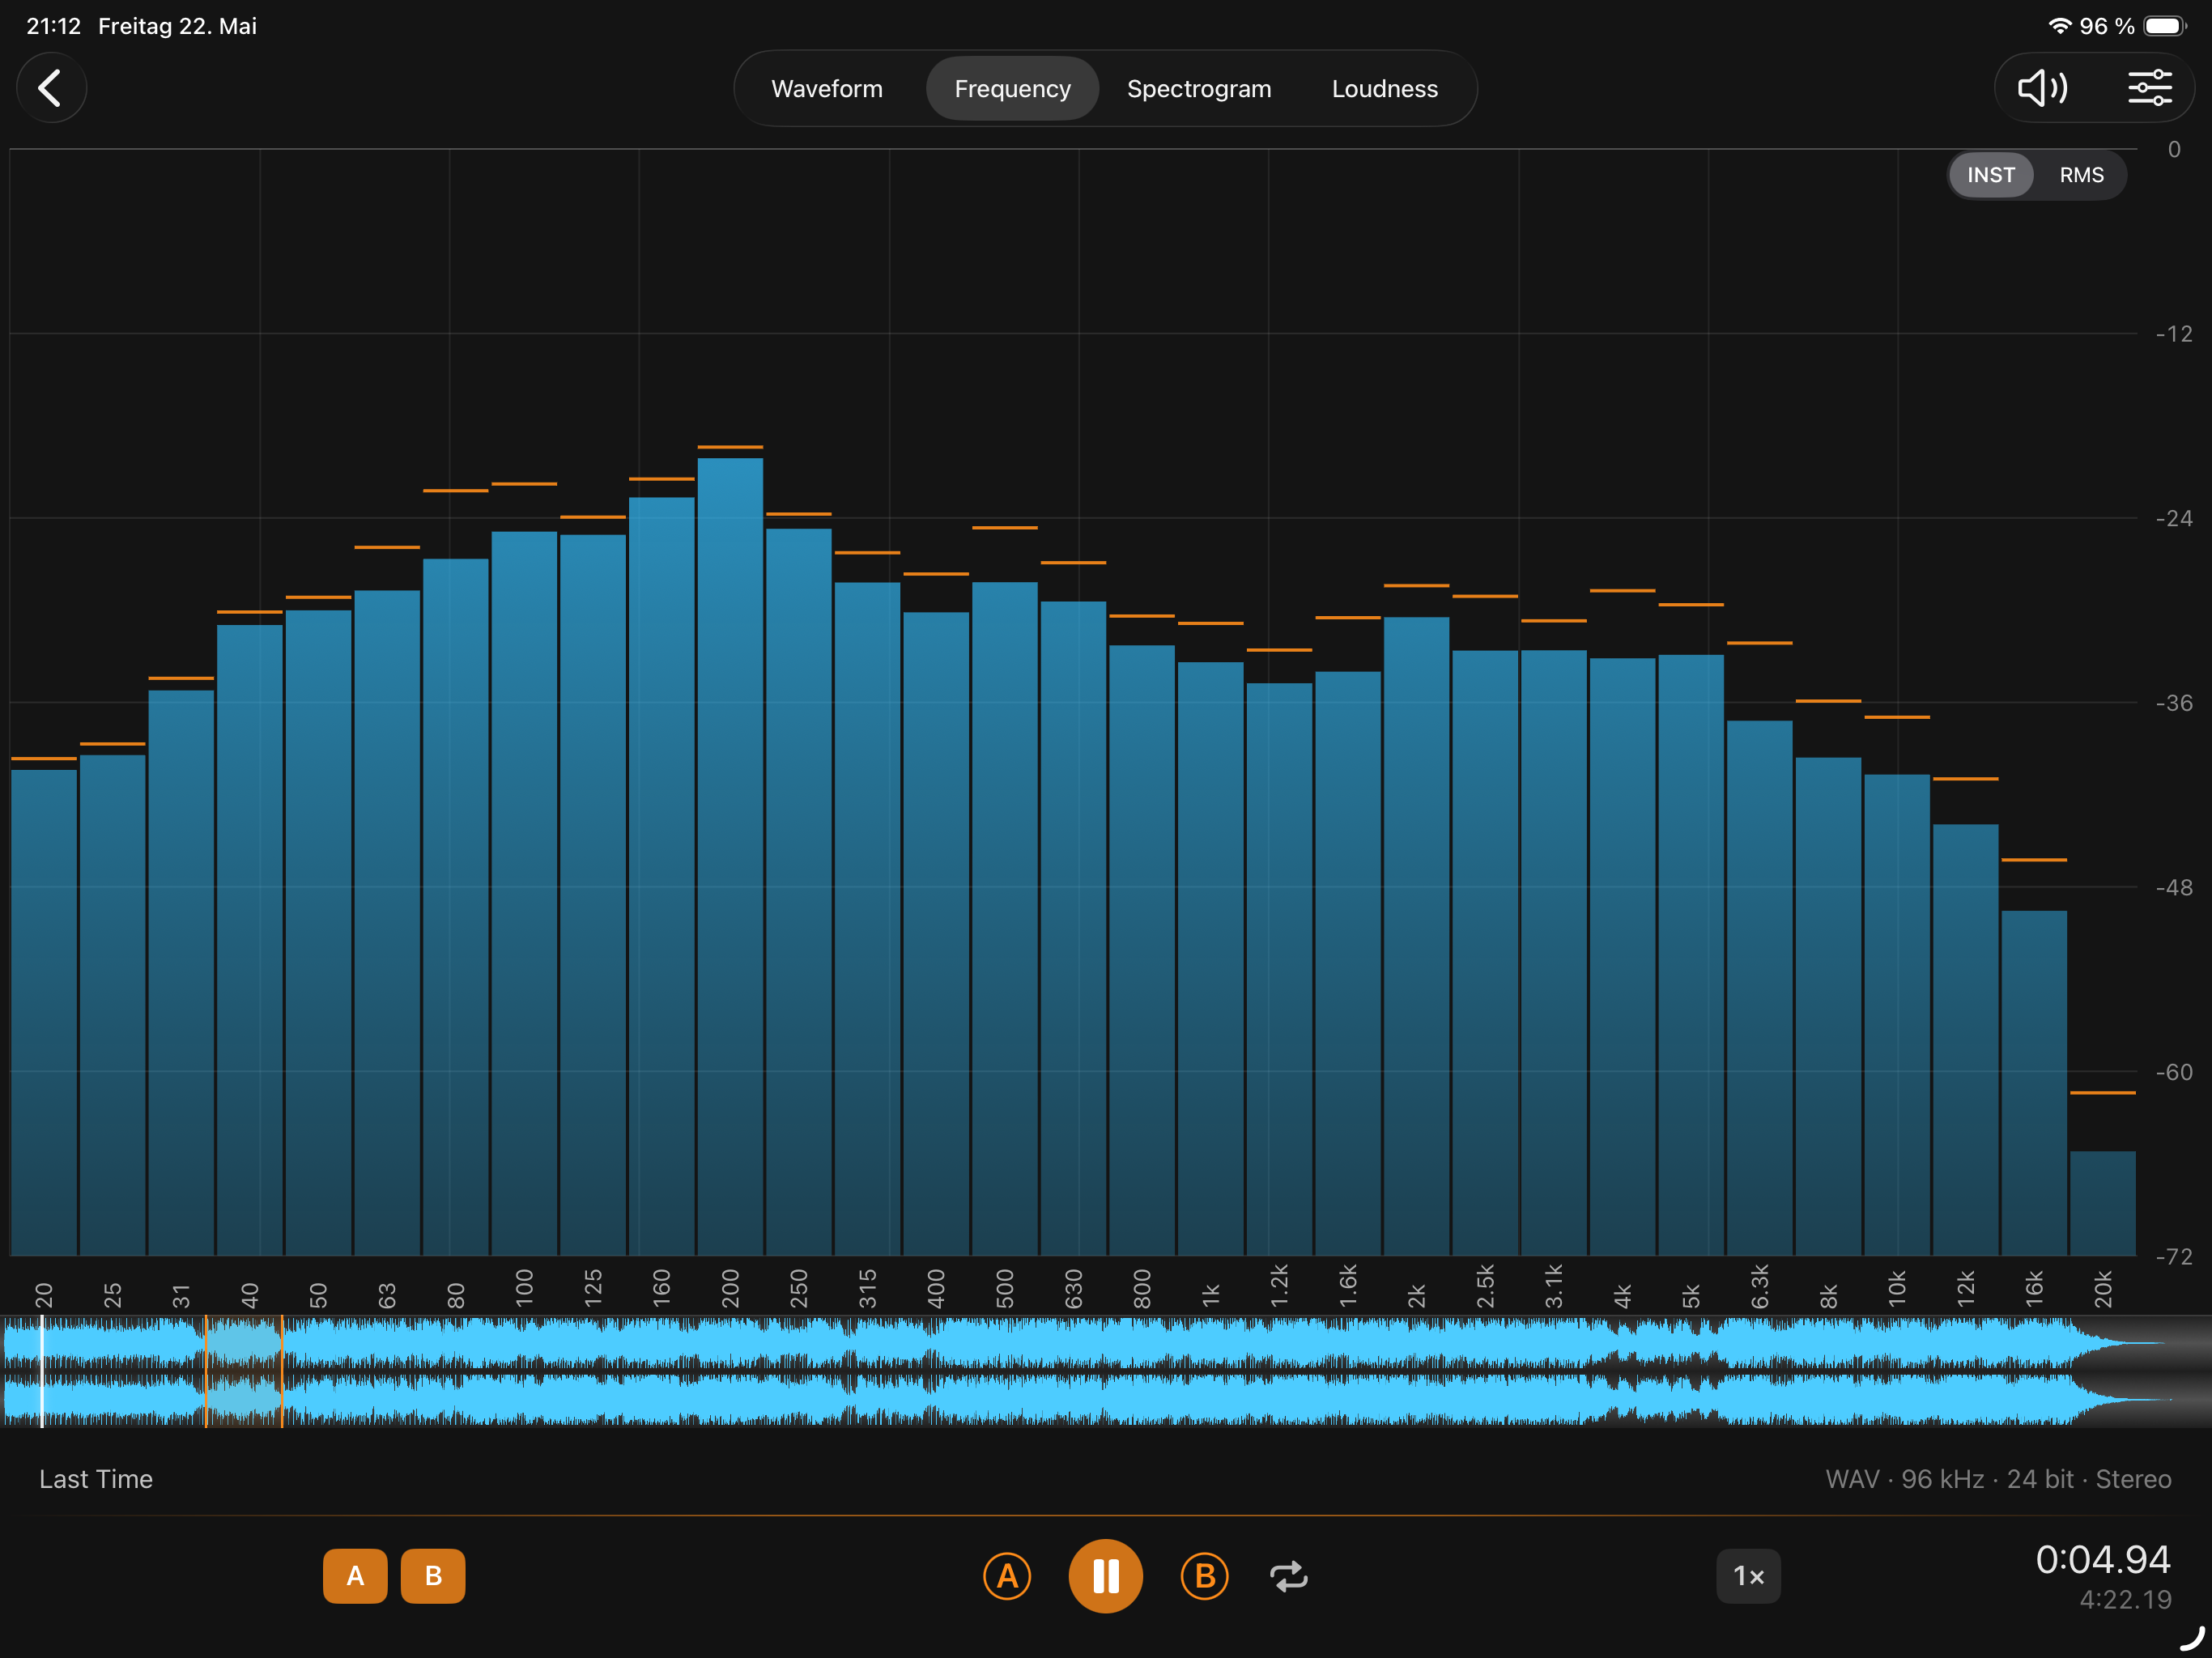
- Frequency analyzer with optional RMS smoothing.
Whatever your DAW exports, SpectraView Studio reads.
SpectraView Studio uses Apple's AVFoundation decoder, so anything the system can play, the app can analyze. Verified file types: WAV, AIFF, MP3, AAC, ALAC, FLAC and CAF. Stereo and mono. 16-bit, 24-bit and float, at any sample rate AVFoundation supports.
Live monitoring is on the roadmap.
A future update will turn SpectraView Studio from a file analyser into a live monitoring tool — continuous input from the iPad mic or any USB-C audio interface, with the same BS.1770-4 DSP core that drives the file-mode numbers today.
Live monitoring will be available as an in-app purchase. The file analyser you have today stays free, and existing users keep everything they have.